|
FREQUENCY CONSIDERATIONS FOR TELEMETRY 1.0 Purpose 2.0 Scope 3.0 Authorization to Use a Telemetry System 4.0 Frequency Usage Guidance 5.0 Bandwidth 6.0 Spectral Occupancy Limits Footnotes 1.0 Purpose This appendix was prepared with the cooperation and assistance of the RCC Frequency Management Group (FMG). This appendix provides guidance to telemetry users for the most effective use of the ultra high frequency (UHF) telemetry bands 1435 to 1535 MHz, 2200 to 2290 MHz, and 2310 to 2390 MHz. Coordination with the frequency managers of the applicable test ranges and operating areas is recommended before a specific frequency band is selected for a given application. Government users should coordinate with the appropriate Area Frequency Coordinator and commercial users should coordinate with the Aerospace and Flight Test Radio Coordinating Council (AFTRCC). A list of the points of contact can be found in the National Telecommunications and Information Administration's (NTIA) Manual of Regulations and Procedures for Federal Radio Frequency Management. 2.0 Scope 2.1 Definitions 2.2 Other Notations This appendix is to be used as a guide by users of telemetry frequencies at DOD-related test ranges and contractor facilities. The goal of frequency management is to encourage maximal use and minimal interference among telemetry users and between telemetry users and other users of the electromagnetic spectrum. 2.1 Definitions. The following terminology is used in this appendix. Allocation (of a frequency band). Entry in the Table of Frequency Allocations1 of a given frequency band for the purpose of its use by one or more radio communication services or the radio astronomy service under the specified conditions. Assignment (of a radio frequency or radio frequency channel). Authorization given by an administration for a radio station to use a radio frequency or radio frequency channel under specified conditions. Authorization. Permission to use a radio frequency or radio frequency channel under specified conditions. Certification. The Military Communications-Electronics Board’s (MCEB) process of verifying that a proposed system complies with the appropriate rules, regulations, and technical standards. J/F 12 Number. The identification number assigned to a system by the MCEB after the Application for Equipment Frequency Allocation (DD form 1494) is approved, for example, J/F 12/6309 (sometimes called the J-12 number). Resolution bandwidth. The -3 dB bandwidth of the measurement device. 2.2 Other Notations. The following notations are used in this appendix. Other references may define these terms slightly differently. |
| B99% | Bandwidth containing 99 percent of the total power |
| B-25dBm | Bandwidth containing all components larger than -25 dBm |
| B-60dBc | Bandwidth containing all components larger than the power level that is 60 dB below the unmodulated carrier power |
| dBc | Decibels relative to the power level of the unmodulated carrier |
| fo | Assigned center frequency |
|
3.0 Authorization to Use a Telemetry System 3.1 Spectrum Certification 3.1.1 Frequency Allocation 3.1.1.1 Telemetry Bands 3.1.1.2 VHF Telemetry 3.1.2 Technical Standards 3.2 Frequency Authorization Permission to use the radio frequency spectrum is required by federal law. Permission is obtained through a two-step process (spectrum certification and frequency authorization) managed by the NTIA on behalf of the president. A DD Form 1494, Application for Equipment Frequency Allocation, initiates the process. 3.1 Spectrum Certification. The DD Form 1494 should be submitted through military frequency management channels for review and approval. Coordination of military systems with the other federal departments and agencies and with the Federal Communications Commission (FCC) is accomplished during this process through monthly meetings of the Interdepartmental Radio Advisory Committee (IRAC) and its subcommittees. The review process checks for compliance with the National Table of Frequency Allocations2 and applicable technical standards, and if compliant, the telemetry system receives spectrum certification and is issued a J/F 12 number. Systems that receive certification must then request a frequency authorization (that is, an assignment) to radiate. This complete process may take a year or more. 3.1.1 Frequency Allocation. As stated before, telemetry systems must normally operate within the frequency bands designated for their use in the National Table of Frequency Allocations. With sufficient justification, use of other bands may at times be permitted, but the certification process is much more difficult and the outcome is uncertain. Even if certification is granted (on a noninterference basis to other users), the frequency manager is often unable to grant assignments because of local users who will receive interference. 3.1.1.1 Telemetry Bands. Air- and space-to-ground telemetering is allocated in the UHF bands 1435 to 1535, 2200 to 2290, and 2310 to 2390 MHz; commonly known as the L band, the S band, and the upper S band. 3.1.1.2 VHF Telemetry. The very high frequency (VHF) band 216-265 MHz was used for telemetry operations in the past. Telemetry was moved to the UHF bands as of 1 January 1970 to prevent interference to critical government land mobile and military tactical communications. Telemetry operation in this band is strongly discouraged and is considered only on an exceptional case-by-case basis. 3.1.2 Technical Standards. The MCEB and the NTIA review proposed telemetry systems for compliance with applicable technical standards. For the UHF telemetry bands, the current revisions of the following standards are considered applicable:
3.2 Frequency Authorization. Spectrum certification of a telemetry system verifies that the system meets the technical requirements for successful operation in the electromagnetic environment. However, a user is not permitted to radiate with the telemetry system before requesting and receiving a specific frequency assignment. The assignment process takes into consideration when, where, and how the user plans to radiate. Use of the assignments is tightly scheduled by and among the individual ranges to make the most efficient use of the limited telemetry radio frequency (RF) spectrum and to ensure that one user does not interfere with other users. 4.0 Frequency Usage Guidance 4.1 Frequency Assignments 4.2 Geographical Separation 4.3 Simultaneous Operation. 4.4 Multicarrier Operation 4.5 Transmitter Antenna System Emission Testing Frequency uses are controlled by scheduling in the areas in which the tests will be conducted. The following recommendations are based on good engineering practice for such usages. 4.1 Frequency Assignments. Frequency scheduling for simultaneous use at the same location typically will not be made for systems whose closest 99 percent power band edges are separated by less than the 99 percent bandwidth of the wider of the two. (The signals must also comply with the spectral mask presented in paragraph 6.1 of this appendix). Figure A-1 shows the radio frequency spectrum of two signals being transmitted simultaneously. 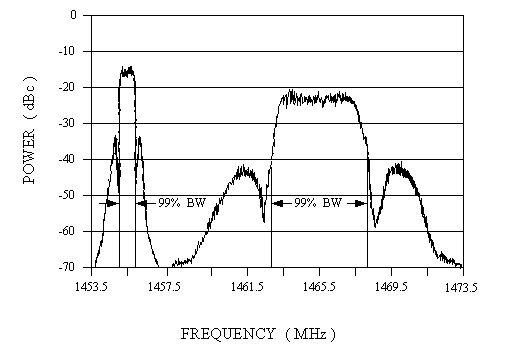 The left signal center frequency is 1455.5 MHz with 800 kbps modulation. The right signal center frequency is 1465.5 MHz with 5 Mbps modulation. The 99 percent power bandwidths of these two signals are approximately 930 kHz and 5800 kHz. (See first line of table A-1). Therefore, the minimum center frequency separation is (930+5800)/2 + 5800 = 9165 kHz. Because all telemetry signals are centered on xxxx.5 MHz, the separation must be an integer number of MHz. The smallest integer number of MHz larger than 9165 kHz is 10 MHz. Scheduling as stated here should ensure a desired signal to interfering signal ratio of at least 40 dB for two signals of equal bandwidth and effective radiated power at the same distance from the receiving antenna when the receiver bandwidth includes less than 99 percent of the desired signal's energy. In instances when this ratio is insufficient to ensure desired data quality, the frequency separation must be increased. 4.2 Geographical Separation. Two or more telemetry systems operating in a given geographical area 3 should be separated in frequency such that overlap between spectra for each pair of signals is less than 0.5 percent of the power of either in the -20 dB receiver passband of the other. Overlap separation can be provided by a combination of frequency selection, power levels, antenna positioning and aiming, and geographical separation. 4.3 Simultaneous Operation. Standard practice for multiple emitters at the same location, power level, and transmitting antenna direction (if applicable) is to separate signals from one another by a "guard band" greater than or equal to the occupied bandwidth of the widest bandwidth signal in each pair of adjacent frequency transmitters. When more than one transmitter is used on the same host vehicle, frequency selection should be made to minimize spectrum overlap and RF interactions. Multichannel operations should avoid channels separated by the IF frequencies of the receivers used if possible.4 4.4 Multicarrier Operation. If two transmitters are operated simultaneously and send or receive through the same antenna system, interference because of intermodulation is likely at (2f 1 - f2) and (2f2 - f1). Between three transmitters, the two-frequency possibilities exist, but intermodulation products may exist as well at (f1 + f2 - f3), (f1 + f 3 - f2), and (f2 + f3 - f1), where f1, f2, and f3 represent the output frequencies of the transmitters. Intermodulation products can arise from nonlinearities in the transmitter output circuitry which cause mixing products between a transmitter output signal and the fundamental signal coming from nearby transmitters. Intermodulation products also can arise from nonlinearities in the antenna systems. The generation of intermodulation products is inevitable, but the effects are generally of concern only when such products exceed -25 dBm. The general rule for avoiding third-order intermodulation interference is that in any group of transmitter frequencies, the separation between any pair of frequencies should not be equal to the separation between any other pair of frequencies. Because individual signals have sidebands, it should be noted that intermodulation products have sidebands spectrally wider than the sidebands of the individual signals that caused them. 4.5 Transmitter Antenna System Emission Testing. Radiated tests will be made in lieu of transmitter output tests only when the transmitter is inaccessible. Radiated tests may still be required if the antenna is intended to be part of the filtering of spurious products from the transmitter or is suspected of generating spurious products by itself or in interaction with the transmitter and feedlines. The tests should be made with normal modulation. 5.0 Bandwidth 5.1 Concept 5.1.1 Authorized Bandwidth 5.1.2 Occupied Bandwidth 5.1.3 Necessary Bandwidth 5.1.4 Received (or Receiver) Bandwidth 5.2 Bandwidth Estimation and Measurement 5.2.1 99 Percent Power Bandwidth 5.2.2 -25 dBm Bandwidth 5.2.3 Other Bandwidth Measurement Methods 5.2.3.1 Below Unmodulated Carrier 5.2.3.2 Below Peak 5.2.3.3 Carson's Rule 5.2.4 Spectral Equations 5.2.5 Receiver Bandwidth 5.2.6 Receiver Noise Bandwidth 5.3 Phase-Modulated Systems 5.4 Symmetry 5.5 FM Transmitters (ac Coupled) The definitions of bandwidth in this section are universally applicable. The limits shown here are applicable for telemetry operations in the telemetry bands 1435 to 1535, 2200 to 2290, and 2310 to 2390 MHz. For the purposes of telemetry signal spectral occupancy, the bandwidths used are the 99 percent power bandwidth and the -25 dBm bandwidth. A power level of -25 dBm is exactly equivalent to an attenuation of the transmitter power by 55 + 10xlog(P) dB where P is the transmitter power expressed in watts. How bandwidth is actually measured and what the limits are expressed in terms of that measuring system are detailed in the following paragraphs. 5.1 Concept. The term "bandwidth" has an exact meaning in situations where an amplitude modulation (AM), double side band (DSB), or single side band (SSB) signal is produced with a band-limited modulating signal. In systems employing frequency modulation (FM) or phase modulation (PM), or any modulation system where the modulating signal is not band limited, bandwidth is infinite with energy extending toward zero and infinite frequency falling off from the peak value in some exponential fashion. In this more general case, bandwidth is defined as the band of frequencies in which most of the signal's energy is contained. The definition of "most" is imprecise. The following terms are applied to bandwidth. 5.1.1 Authorized Bandwidth. Authorized bandwidth is, for purposes of this document, the necessary bandwidth (bandwidth required for transmission and reception of intelligence) and does not include allowance for transmitter drift or Doppler shift. 5.1.2 Occupied Bandwidth. The width of a frequency band such that below the lower and above the upper frequency limits, the mean powers emitted are each equal to a specified percentage of the total mean power of a given emission. Unless otherwise specified by the International Telecommunication Union (ITU) for the appropriate class of emission, the specified percentage shall be 0.5 percent. The occupied bandwidth is also called the 99 percent power bandwidth in this document. 5.1.3 Necessary Bandwidth. For a given class of emission, the width of the frequency band which is just sufficient to ensure the transmission of information at the rate and with the quality required under specified conditions. 5.1.3.1 The NTIA Manual of Regulations and Procedures for Federal Radio Frequency Management states that "All reasonable efforts shall be made in equipment design and operation by Government agencies to maintain the occupied bandwidth of transmission of any authorized transmission as closely to the necessary bandwidth as is reasonably practicable within the state-of-the-art." 5.1.3.2 The NTIA's equation for calculating the necessary bandwidth of binary nonreturn-to-zero (NRZ) continuous phase frequency shift keying (CPFSK) is 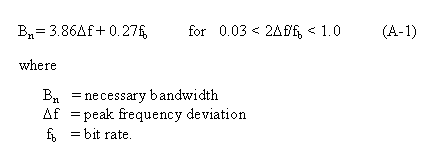 |
|
This modulation method is commonly called NRZ pulse code modulation
(PCM)/FM by the telemetry community. For example, assume the bit rate is
1000 kbps and the peak deviation is 350 kHz, the necessary bandwidth is
calculated to be 1621 kHz (using equation (A-1)). With this bit rate and
peak deviation, the 99 percent power bandwidth with no filtering would
be 1780 kHz and the 99 percent power bandwidth with a premodulation filter
bandwidth of 700 kHz would be approximately 1160 kHz. Equations for other
modulation methods are contained in the NTIA Manual of Regulations and
Procedures for Federal Radio Frequency Management. 5.1.4 Received (or Receiver) Bandwidth . The received bandwidth is usually the -3 dB bandwidth of the receiver intermediate frequency (IF) section. 5.2 Bandwidth Estimation and Measurement . Various methods are used to estimate or measure the bandwidth of a signal that is not band limited. The bandwidth measurements are performed using a spectrum analyzer (or equivalent device) with the following settings: 10 kHz resolution bandwidth, 1 kHz video bandwidth, and max hold detector. The IRIG document 106-86 and earlier versions of the Telemetry Standards specified a measurement bandwidth of 3 kHz but did not specify a video bandwidth or a detector type. Spectra measured with the new standard settings will be essentially the same as spectra measured with a 3 kHz resolution bandwidth, 10 kHz video bandwidth, and a max hold detector. However, for signals with random characteristics, the average spectral density measured with a 3 kHz resolution bandwidth without the max hold detector enabled will be approximately 10 dB lower than the spectral density measured with the new settings. Theoretical expressions for power spectral density typically assume random signals and calculate the average spectral density. The average power spectral density in a 10 kHz bandwidth for random signals is approximately 5 dB lower than the spectral density measured with the standard settings (the measured values for large, continuous, discrete spectral components will be the same with an average or a max hold detector). The most common measurement and estimation methods are described in the following paragraphs. 5.2.1 99 Percent Power Bandwidth. This bandwidth contains 99 percent of the total power. The 99 percent power bandwidth is typically measured using a spectrum analyzer or estimated using equations for the modulation type and bit rate used. If the two points which define the edges of the band are not symmetrical about the assigned center frequency, their actual frequencies should be noted as well as their difference. The 99 percent power band edges of randomized NRZ (RNRZ) PCM/FM signals are illustrated in figures A-1 and A-2. Table A-1 presents the 99 percent power bandwidth for several digital modulation methods as a function of the bit rate (fb). |
|
DIGITAL MODULATION METHODS 5 |
| NRZ PCM/FM, premod filter
BW=0.7fb,
|
|
| NRZ PCM/FM, no premod filter,
|
|
| NRZ PCM/FM, no premod filter,
|
|
| NRZ PCM/FM, no premod filter,
|
|
| NRZ PCM/FM, premod filter BW=0.7fb
, |
|
| Minimum shift keying (MSK), no filter | |
| Phase shift keying (PSK), premod filter BW=0.7fb | |
| PSK, no filter 19.30 fb | |
| Quadrature phase shift keying (QPSK), no filter | |
| Offset QPSK (OQPSK), sinusoidal weighting |
5.2.2 -25 dBm Bandwidth. The bandwidth
beyond which all power levels are below -25 dBm. A power level of -25 dBm
is exactly equivalent to an attenuation of the transmitter power by
55 + 10 x log(P) dB where P is the transmitter power expressed in watts.
The -25 dBm bandwidth limits are shown
in figure A-2.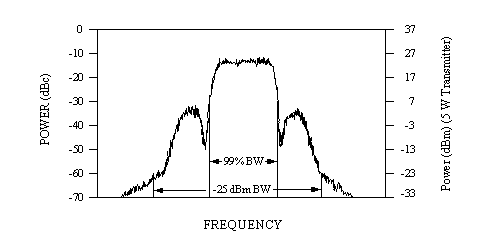 5.2.3 Other Bandwidth Measurement Methods. The previous methods are the standard methods for measuring the bandwidth of telemetry signals. The following methods are also sometimes used to measure or to estimate the bandwidth of telemetry signals. 5.2.3.1 Below Unmodulated Carrier . This method measures the power spectrum with respect to the unmodulated carrier power. To calibrate the measured spectrum on a spectrum analyzer, the unmodulated carrier power must be known. This power level is the 0 dB reference (commonly set to the top of the display). In AM systems, the carrier power never changes; in FM and PM systems, the carrier power is a function of the modulating signal. Since angle modulation (FM or PM) by its nature spreads the spectrum of a constant amount of power, a method to estimate the unmodulated carrier power is required if the modulation can not be turned off. For most practical angle modulated systems, the total carrier power at the spectrum analyzer input can be found by setting the spectrum analyzer's resolution and video bandwidths to their widest settings, setting the analyzer output to max hold, and allowing the analyzer to make several sweeps (see figure A-3). The maximum value of this trace will be a good approximation of the unmodulated carrier level. Figure A-3 shows the spectrum of a 5 Mbps RNRZ PCM/FM signal measured using the standard spectrum analyzer settings discussed previously and the spectrum measured using 3 MHz resolution and video bandwidths and max hold. The peak of the spectrum measured with the latter conditions is very close to 0 dBc and can be used to estimate the unmodulated carrier power (0 dBc) in the presence of frequency or phase modulation. In practice, the 0 dBc calibration would be performed first, and the display settings would then be adjusted to use the peak of the curve as the reference level (0 dBc level) to calibrate the spectrum measured using the standard spectrum analyzer settings. With the spectrum analyzer set for a specific resolution bandwidth, video bandwidth and detector type, the bandwidth is taken as the distance between the two points outside of which the spectrum is thereafter some number (say, 60 dB) below the unmodulated carrier power determined above. The -60 dBc bandwidth for the 5 Mbps signal shown in figure A-3 is approximately 13 MHz. 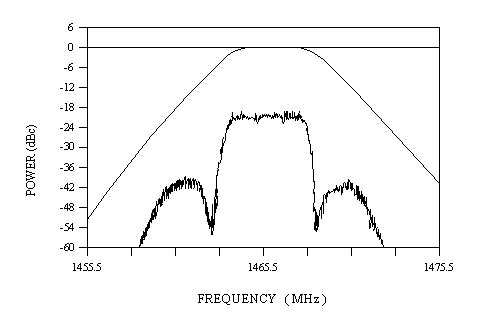 The -60 dBc bandwidth of a random NRZ PCM/FM signal with a peak deviation of 0.35fb, a four-pole premodulation filter with -3 dB corner at 0.7fb, and a bit rate greater than or equal to 1 Mbps can be approximated by |
| B-60dBc = { 2.78 - 0.3 x log10(fb) } x fb | (A-2) |
|
where B is in MHz and fb is in Mbps. Thus the -60 dBc bandwidth of
a 5 Mbps RNRZ signal under these conditions would be 12.85 MHz.
The -60 dBc bandwidth will be greater if peak deviation is increased
or the number of filter poles is decreased. 5.2.3.2 Below Peak. This method is not recommended for measuring the bandwidth of telemetry signals. The modulated peak method is the least accurate measurement method, measuring between points where the spectrum is thereafter XX dB below the level of the highest point on the modulated spectrum. Figure A-4 shows the radio frequency spectrum of a 400 kbps Bi 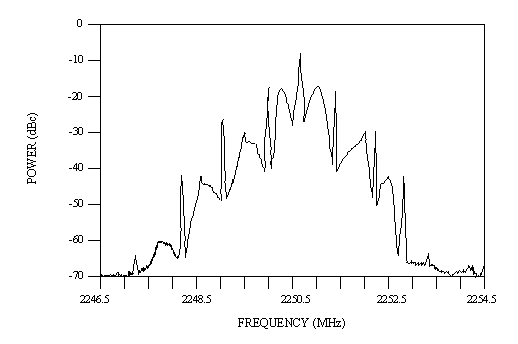 This 15 dB difference would skew a bandwidth comparison which used the peak level in the measured spectrum as a common reference point. In the absence of an unmodulated carrier to use for calibration, the below peak measurement is often (erroneously) used and described as a below unmodulated carrier measurement. Using max hold exacerbates this effect still further. In all instances the bandwidth is overstated, but the amount varies. 5.2.3.3 Carson's Rule. Carson's rule is a method to estimate the bandwidth of an FM subcarrier system. Carson's rule states that 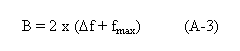  5.2.4 Spectral Equations. The following equations can be used to calculate the RF spectra for several digital modulation methods with unfiltered waveforms. 6 7 8 These equations can be modified to include the effects of filtering. 9 10 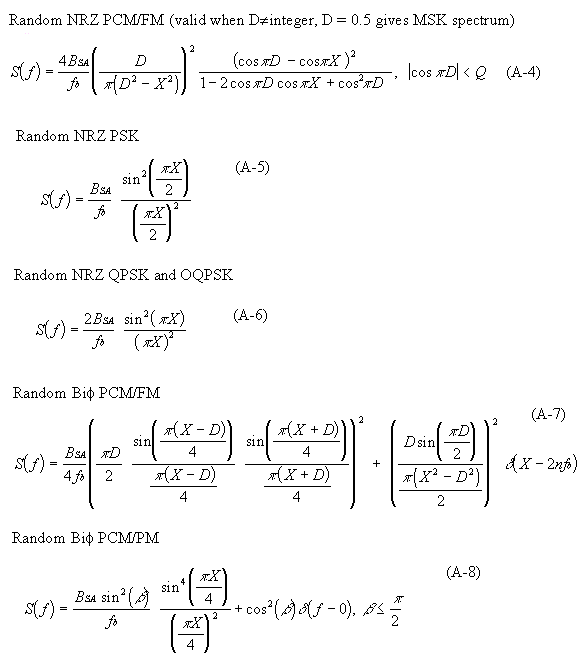 where 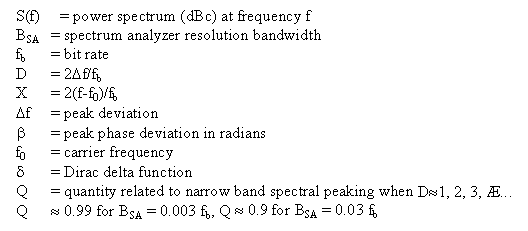 The spectrum analyzer resolution bandwidth term was added to the original equations. 5.2.5 Receiver Bandwidth. Receiver predetection bandwidth is measured at the points where the response to the carrier before demodulation is -3 dB from the center frequency response. The carrier bandwidth response of the receiver is, or is intended to be, symmetrical about the carrier in most instances. Figure A-6 shows the response of a typical telemetry receiver with a 1 MHz IF bandwidth selected. 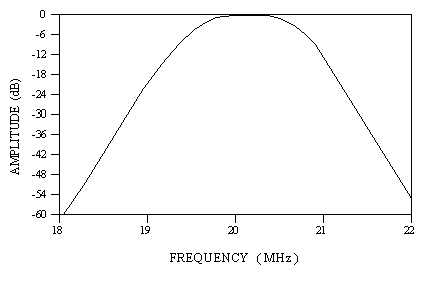
Outside the stated bandwidth, the response usually falls sharply with the response often 20 dB or more below the passband response at 1.5 to 2 times the passband response. The rapid falloff outside the passband is required to reduce interference from nearby channels and has no other effect on data. 5.2.6 Receiver Noise Bandwidth . For the purpose of calculating noise in the receiver, the bandwidth must be integrated over the actual shape of the IF which, in general, is not a square-sided function. Typically, the figure used for noise power calculations is the -3 dB bandwidth of the receiver. 5.3 Phase-Modulated Systems. Telemetry systems using phase modulation (PM) rather than frequency modulation (FM) produce spectra, which may be considerably wider than the corresponding FM signal. This extra sideband energy is reduced in most systems by filtering at the modulation input, or the transmitter output, or both, and sideband energy is reconstructed in the receiving apparatus as part of the demodulation process. Phase-modulation systems, even with more than one data bit per symbol, are not necessarily more spectrally efficient than FM transmissions. 5.4 Symmetry. Most modulation methods produce a spectrum, which is asymmetrical with respect to the carrier frequency, when FM transmission is used. Exceptions include FM subcarrier systems and PCM NRZ systems using randomization or Bi 5.5 FM Transmitters (ac Coupled). The ac-coupled FM transmitters should not be used to transmit NRZ signals unless the signals to be transmitted are randomized, because changes in the ratio of “ones” to “zeros” will increase the occupied bandwidth and may degrade the data quality. When ac-coupled transmitters are used with randomized NRZ signals, it is recommended that the lower -3 dB frequency response of the transmitter be no greater than the bit rate divided by 4000. For example, if a randomized 1 Mbps NRZ signal is being transmitted, the lower -3 dB frequency response of the transmitter should be no larger than 250 Hz. 6.0 Spectral Occupancy Limits 6.1 Spectral Mask 6.1 Spectral Mask Examples For the purposes of telemetry signal spectral occupancy, unless stated otherwise, the bandwidths11 used are the 99 percent power bandwidth and the -25 dBm bandwidth. The spectra are assumed symmetrical about the center frequency unless specified otherwise. The primary reason for controlling the spectral occupancy is to control adjacent channel interference, thereby allowing more users to be packed into a given amount of frequency spectrum. The adjacent channel interference is determined by the spectra of the signals and the filter characteristics of the receiver. 6.1 Spectral Mask. One common method of describing the spectral occupancy limits is a spectral mask. The aeronautical telemetry spectral mask is described below. All spectral components attenuated by a value less than 55 + 10xlog(P) dB (or in other words larger than -25 dBm) at the transmitter output must be within the spectral mask calculated using  where  The negative of A(f) is the power with respect to the unmodulated carrier power (units of dBc). The spectral mask calculated using equation (A-9) can also be expressed in terms of power (dBm) using  P(f) is not required to be less than -25 dBm and the -25 dBm bandwidth is not required to be narrower than 1 MHz. The first term in equation (A-9) forces the attenuation to be proportional to the transmitter power level. The 10logX term accounts for the increased spectral spreading as the modulation bandwidth increases. The last term forces the spectral mask to roll off at 30 dB/octave (100 dB/decade). The square root of the log2 of the number of signaling states accounts for the fact that higher order modulation methods typically occupy less bandwidth than an equivalent lower order modulation method. Any error detection or error correction bits, which are added to the data stream, are counted as bits for the purposes of this spectral mask. The spectral mask is based on the power spectrum of a random binary NRZ PCM/FM signal with peak deviation equal to 0.35 times the bit rate and a multipole premodulation filter with a -3 dB frequency equal to 0.7 times the bit rate (see figure A-7). This peak deviation minimizes the bit error rate (BER) while also providing a compact RF spectrum. The premodulation filter attenuates the RF sidebands while only degrading the BER by the equivalent of a few tenths of a dB of RF power. Further decreasing of the premodulation filter bandwidth will only result in a slightly narrower RF spectrum but the BER will increase dramatically. Increasing the premodulation filter bandwidth will result in a wider RF spectrum and the BER will only be decreased slightly. The recommended premodulation filter for NRZ PCM/FM signals is a multipole linear phase filter with a -3 dB frequency equal to 0.7 times the bit rate. The spectral mask includes the effects of reasonable component variations (unit-to-unit and temperature). 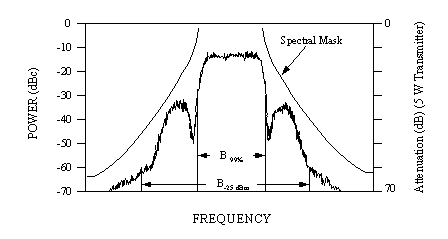 6.2 Spectral Mask Examples. Figures A-7 and A-8 show the spectral mask of equations (A-9) and (A-10) and the RF spectra of a 1000 kbps randomized NRZ PCM/FM signal. The RF spectra were measured using a spectrum analyzer with 10 kHz resolution bandwidth, 1 kHz video band-width, and a max hold detector. The transmitter power was 5 watts and the peak deviation was 350 kHz. The modulation signal for figure A-7 was filtered with a 4-pole linear-phase filter with -3 dB frequency of 700 kHz. The 99 percent power and -25 dBm band edges are also indicated in figure A-7. All spectral components in figure A-7 are contained within the spectral mask. The minimum value of the spectral mask is -62 dBc (equivalent to -25 dBm). The peak modulated signal power levels are about 15 dB below the unmodulated carrier level. Figure A-8 shows the same signal with no premodulation filtering. The signal was not contained within the spectral mask when a pre-modulation filter was not used. 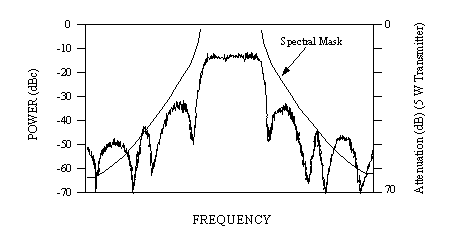 Figure A-9 shows the calculated spectrum of a random 1000 kbps OQPSK signal with sinusoidal weighting (this signal is also called an MSK signal12 13 ). Sinusoidal weighting means that the modulation signal is a positive half sine wave for a “1" and a negative half sine wave for a “0." Since OQPSK is a quaternary signal m = 2, therefore, the spectral mask is narrower than the mask for the binary signals in figures A-7 and A-8. Additional filtering (or weighting) would be required to make this signal fit within the spectral mask. 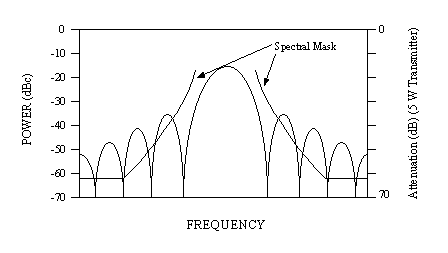 Appendix A Footnotes 1. The definitions of the radio services that can be operated within certain frequency bands contained in the radio regulations as agreed to by the member nations of the International Telecommunications Union. This table is maintained in the United States by the Federal Communications Commission and the NTIA. 2. NTIA, Manual of Regulations and Procedures for Federal Radio Frequency Management. 3. The extent of a geographical area over which the frequency use must be protected varies with the nature of the usage. For airborne systems, such an area is specified by the actual vehicle flight path and its maximum altitude. 4. In theory, at least, J/F 12 data exist on all receivers as well as transmitters. 5. I. Korn, Digital Communications, New York, Van Nostrand, 1985. 6. I. Korn, Digital Communications, New York, Van Nostrand, 1985. 7. M. G. Pelchat, "The Autocorrelation Function and Power Spectrum of PCM/FM with Random Binary Modulating Waveforms," IEEE Transactions, Vol. SET-10, No. 1, pp. 39-44, March 1964. 8. W. M. Tey, and T. T. Tjhung, "Characteristics of Manchester-Coded FSK," IEEE Transactions on Communications, Vol. COM-27, pp. 209-216, January 1979. 9. A. D. Watt, V. J. Zurick, and R. M. Coon, "Reduction of Adjacent-Channel Interference Components from Frequency-Shift-Keyed Carriers," IRE Transactions on Communication Systems, Vol. CS-6, pp. 39-47, December 1958. 10. E. L. Law, "RF Spectral Characteristics of Random PCM/FM and PSK Signals," International Telemetering Conference Proceedings, pp. 71-80, 1991. 11. These bandwidths are measured using a spectrum analyzer with a 10 kHz resolution bandwidth, a 1 kHz video bandwidth, and a max hold detector. 12. I. Korn, Digital Communications, New York, Van Nostrand, 1985. 13. B. Sklar, Digital Communications, Fundamentals and Applications, New Jersey, Prentice Hall, 1988. |