OTIS-Display is a Windows-based application to display data in real-time. This application has the
ability to display data in the following formats:
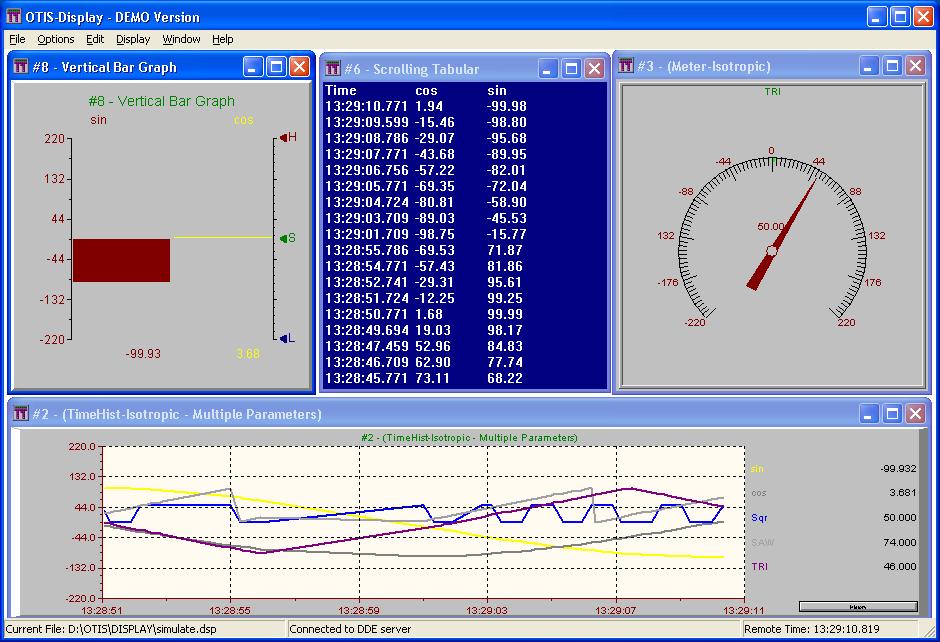
Time History
XY Plot
Fixed Tabular
Scrolling Tablular
Horizontal Bar Graph
Vertical Bar Graph
Meters
Additional Features Of OTIS-Display
The user can group together and save multiple graphs and displays for
later recall. This feature allows the user to customize screens to
suit his needs.
The user can define and display measurements and titles for each
measurement in each graph.
The user can customize display attributes for each graph.
Customization options include (but are not limited to) colors,
fonts, size, shape, labels, titles, grid lines, and plotting
lines.
The user can copy graphs from OTIS-Display into the Windows
Clipboard and then paste the graphs into other Windows
applications.